Here are two stories that highlight problems that occur when nothing is regulated, especially server configuration and handling of abnormal situations
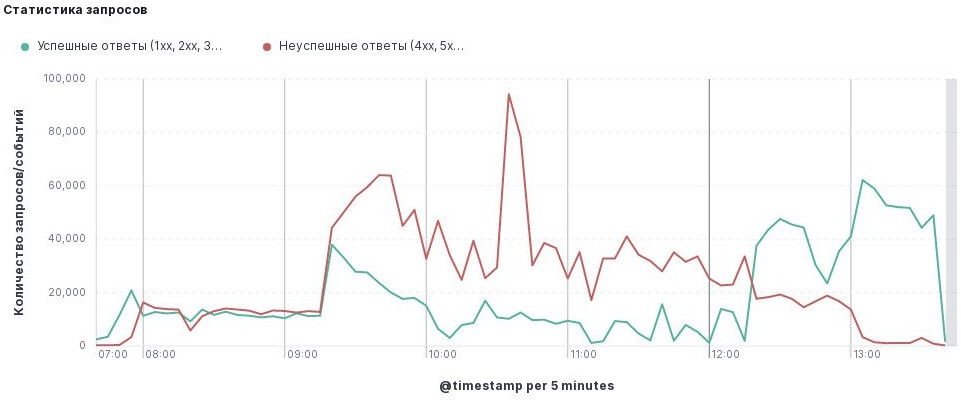
Friday, 8:00 AM. I fired up my workstation and immediately was assigned to look into 5xx errors that came from internal web portal. It responded correctly from time to time. As soon as I dug up credentials for the server that hosted this portal, something similar happened to another server.
Web page with a critical Django app decided to not respond on second server. At all.
Thankfully, server was online, you could connect to it through SSH. But the amount of errors from nginx proxy in Elasticsearch was skyrocketing.
I was assigned to investigate ASAP as I was a "Linux guy" after all.
Part 1 - panik

What is going on?
We've started looking into nginx logs and found out that they had an error about Resource temporarily unavailable when connecting to upstream socket. Everyone started searching the Web for solutions (says a lot about our computer literacy) and the 99% of pages said that we need to increase limits (ulimit) for files and sockets. That resolved errors from nginx proxy to application server (that hosted it's own nginx). We also increased DDoS limit on the main router/firewall just to be sure that it won't be in the way.
After two hours, the guy that originally configured the server came to help us, even though he worked for us long time ago. I've sent him logs and configuration files from nginx and uWSGI to examine.
As I am not proficient in Python or Django or uWSGI, I didn't know what to change. Thankfully, the rescue guy told us to increase listen limits and change socket type from UNIX to HTTP. After an hour of sending logs and assumptions back and forth, we also increased processess count for uWSGI.
We need a more radical solution
So, after all of that we've come to conclusion that we need to increase CPU and memory resources, because now the server responds as fast as it can, but that is not enough.
By 12:30 PM, over 4 hours after the incident, we've shut down the server and increased CPU and RAM. Average server response was about a minute, but it was always a successful response!
Next two days were smooth, but now we have a server that doesn't handle high load very well.
Part 2 - blame the DNS programmers
It's always DNS! What are you saying? It is not? Oh... what is the problem then? I thought it was always DNS.
Well... they are using inferior language! And they write bad code! (last is partly the blame, I read it)
Jocking aside, I returned back to the first server that was also in bad shape. We've kept the second server with critical app running as is and forgot about it.
Investigating of what may be wrong started with discovering what was installed on the system, how it was configured, etc. Programmers didn't know a penny about how it works, because they got a job at our place after the old team quit at once.
I was greeted with Have fun... login prompt. I will... for sure.
In /var/log I found that firewall rules were spamming messages every 5-10 seconds. Turns out there was packet limiter in iptables that wrote a message if it was exceeded. I disabled it, but there was no difference.
Two weeks later, virtual machine with this server was planned to be migrated from Hyper-V to Proxmox at the weekend. Late in the evening I was greeted with "it migrated but network doesn't work, help". It was a common problem with network interfaces name. YaST links network settings with a name of an interface and it had changed (because of migration, duh). Applying old settings to a new adapter fixed the problem. One of the addresses was forgotten, so that evolved into another problem in the morning. It was added back as soon as some syncronization didn't complete at night.
What was not doing well is PostgreSQL database. There were a lot of strange problems: high usage on single core, blocking transactions for 10 or more minutes (cron tasks), simple queries that took 2-7 seconds consistently.
It took me too long to dissect a compatible Django debug toolbar version for Django 1.2.1, but it helped a lot with finding long queries that I could use later for testing. One of them took over 60 seconds to complete (85 seconds on average and up to 110 seconds maximum). Every web server in the chain timed out obviously.
Even when running queries in psql they took the same time. I've vacuumed corresponding tables and even whole database, changed cache and work memory size but to no avail. And I couldn't increase PostgreSQL cache over 4 GB because it is 32-bit.
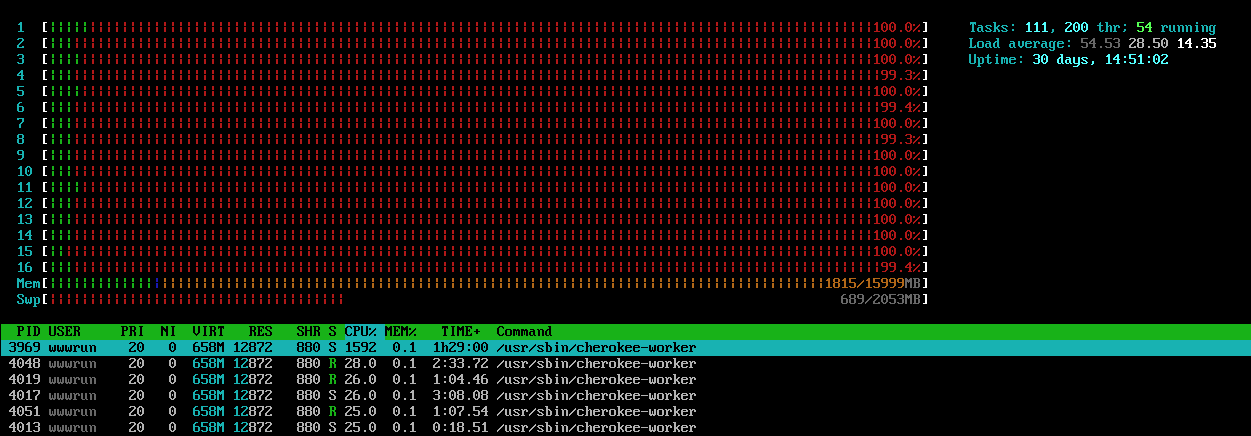
One day server suddenly consumed all of the cores. Cherokee web server workers were doing something fishy. Sometimes even service restart wouldn't help because uWSGI instances were not terminated (they are spawned by Cherokee).
I wasn't pleased with these problems and proposed solutions:
- migrate to 64-bit kernel
- migrate to 64-bit OS (same SuSE Linux version to maintain compatibility)
- migrate to newer OS
No one agreed to any of that, because no one knew how this Django project worked. It has a lot of ties with external servers, 20+ Cron jobs with hacky scripts, dependency on old Python libraries and PostgreSQL plugins.
Considering that a newer version was in development for about a year, everyone said that "we" need to keep old (current) version in somewhat working state until it will be replaced entirely. I think that won't happen soon :)
I decided to move on from database to trying tuning OS itself.
Part 3 - why didn't you say that earlier?
But then, one of the programmers said that slowdown happened after VM migration.
Why did it took an entire month to tell me that?
I started by checking disk speed and was shocked. It acted like an old IDE drive with ATA/100. I tried other VMs on the same physical server and storage and speed was lower than I expected for SSD but not that bad.
And then, I opened VM settings to find that virtual disk was indeed connected as IDE... for crying out loud! Ethernet controller was also not virtio-net.
As I was not the one who migrated VM, I thought everything was fine in terms of settings. I trusted my colleagues that they know their stuff. Well, now I don't. Even if they could not start it on a different disk controller, it would be better to leave it as is on old hypervisor until a solution was available.
So I began checking if kernel 2.6.37 could even accept anything other than IDE in Proxmox. I've somehow glimpsed over virtio-blk support at first but then I did a simple test. I took each of the disk controllers in Proxmox and started an installer to see if it would detect the drive. And it successfully detected virtio-blk disk! I installed OS to see what modules it copies into initramfs and also to test disk speed later.
Last thing I tried before changing disk controller was lowering RAM and CPUs as it is a 32-bit system, maybe PAE was not working as it should. That didn't help at all. Also, I changed swappiness to 20, so that swap is used less to speed up services. RAM amount was reverted to 16 GB to allow a huge file cache.
Switching disk controller was not without issues. YaST is very clumsy and didn't want to update GRUB settings with a new root device path. I did it eventually with manually editing grub.cfg and later updating in YaST.
Even though sequential disk speeds were higher (tested with hdparm) the read/write latency was high when I monitored it in Zabbix. Server still wasn't fast enough, and after a while I found about disk caching.
I've measured speed across multiple servers, different OS versions and different caching modes. Proxmox allows a cache write-through mode that uses host cache for reads and writes are synchronous with the drive. That would speed up reads for database, because it's read most of the time, not written.
Here's the results. Some of the values are very strange and abnormal. But also you can see that write-through speds up reads and write a lot. All of the test were done with fio. They are for sure inaccurate, but after running with write-trough mode for almost two months now, it was a right choice.
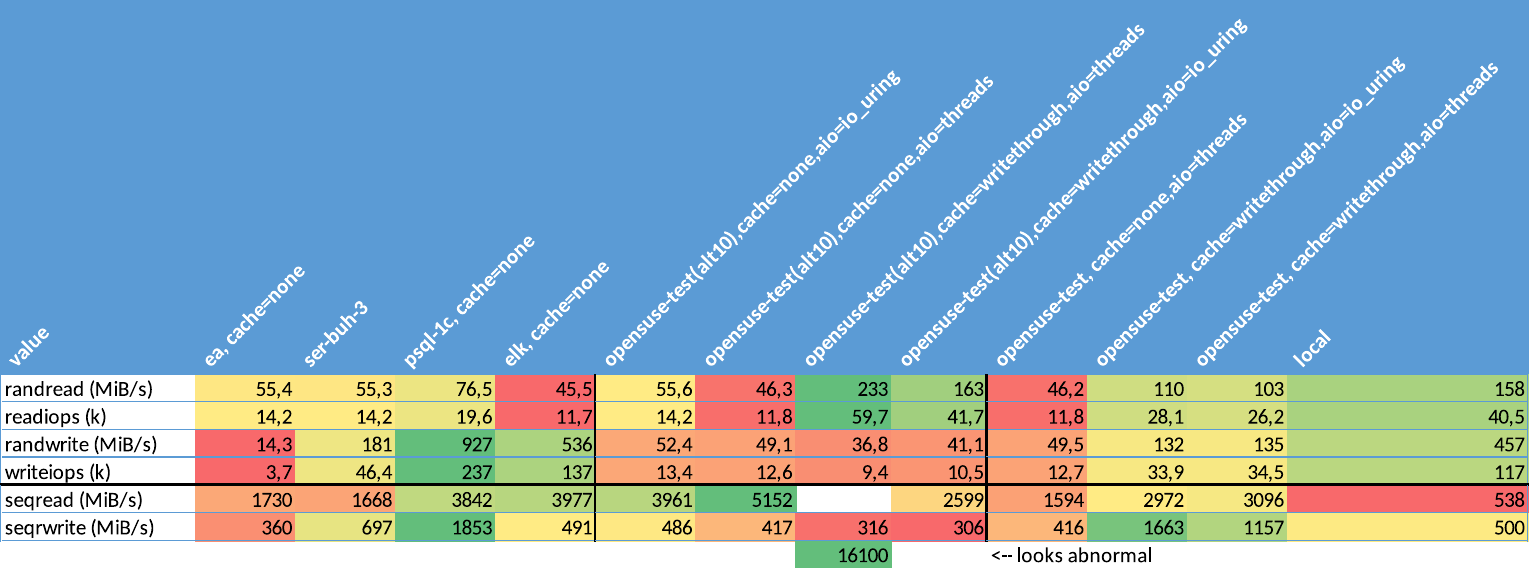
Hosts:
- ea - current VM with virtio-blk, no caching (default)
- ser-buh-3 - Windows Server VM with an accounting software
- psql-1c - Linux VM with a PostgreSQL database, not very active
- elk - Linux VM with Elasticsearch node
- opensuse-test - empty VM with different caching modes and OSes
- alt10 - live CD with ALT Linux 10, kernel 5.xx
- other ones are SuSE Linux 10.4 booted from separate virtual disk
Also, I found out sometime in between speed tests and virtio-blk switch that partitions were not aligned and started not at 2048. It was partitioned for an old RAID controller when this exact system was on a physical server. I repartitioned the drive but that did not gain any performance. I did a wrong conclusion because I tested a clean ext4 partition and an already filled with files. I think that it was slower because of larger files and directories indexes and fragmentation.
Combination of a 12 GB file cache in RAM (16 GB RAM total, 4 GB usable as it's 32-bit) and write-through cache on the host resulted in those long queries to get under a second on average. Even the over a minute long query now takes under a second.
Afterthoughts
If you are still having legacy projects - learn as much as you can, as soon as you can. Do not depend on one person that knows everything. Try to migrate it step by step.
Just as an example - another of our servers had an old OpenSSL version and HTTPS requests were failing to a specific site. Linux distribution that was installed here did not support newer OpenSSL. It was lucky for us to find a newer version compiled by one of the maintainers for himself. Otherwise we would need to migrate to a newer OS or cobble together a solution to proxy unencrypted traffic.
Even if a project is a mess (folder/file hierarchy, bad architecture) - try to clean it up. It will be a timesaver when you know where everything is, especially logs.
Possible and current problems:
- 32-bit OS restricts memory allocation (even with PAE enabled apps do not exceed 4 GB total, only filesystem cache addresses more memory)
- Cherokee can suddenly start spawning workers and pin all cores to 100%. This happened three times at least since the incident. Last time this happened OS would not respond to SSH or console login.
- uWSGI processes do not always shutdown after restarting Cherokee and need to be killed manually, otherwise - no response from uWSGI
- PostgreSQL is old and doesn't use all resources efficiently, maybe.
Cherokee was replaced with latest nginx and a last version of uWSGI that supports Python 2.7. They are running more stable, at least for now.
Those two servers would be under another investigation not long after. But that's a story for another time.